- Why is sales forecasting crucial for eCommerce sellers?
- What exactly is sales forecasting?
- Can’t I just use last year’s sales numbers?
- How does 8fig forecast your store’s sales?
- (The real) Rule no. 1
- Rule no. 2
- Rule no. 3
- Advanced algorithm
- Data clean-up
- What is the baseline?
- What is the launch phase?
- What are sales spikes?
- What are peaks?
- What are dips?
- What are stockouts?
- Flat forecasting
- Seasonal forecasting
- Upcoming features
Why is sales forecasting crucial for eCommerce sellers?
You’ve heard it a million times before: It’s all about supply and demand. As a seller, it’s your job to maintain enough supply to meet demand, while not drowning in excess and stagnant inventory; when an imbalance arises, it’s your job to take the most profitable action for your business.
For example, if you’re running low on supply, you could pump the brakes on advertising or raise product prices, with the goal of increasing margins while slowing demand. On the other hand, if overstocked, you could ramp up advertising or slash prices – effectively boosting sales and avoiding costly inventory fees.
What exactly is sales forecasting?
Sales forecasting is the process of estimating future sales based on historical sales patterns. Think of it as driving your car while only looking in the rearview mirror. It sounds scary, but it works well as long as there are no sudden surprises ahead. For those unexpected sharp curves and roadblocks, we still need a driver looking ahead, but for everything else we can rely on patterns.
According to the Aberdeen Group, companies with precise forecasts are 7-10% more likely to see annual sales growth and are twice as likely to be top performers in their industry. So buckle up as we dive into the world of sales forecasting.

Can’t I just use last year’s sales numbers?
Here’s the thing: Unfortunately, we are not driving on a perfect race track where every lap is the same. Instead, we like to think of eCommerce as an ever-winding country road. New competitors will enter your niche, economies will fluctuate, consumer preferences will shift, and technological advancements will change the way people shop.
Remember, if we’re driving forward while looking backward (which is what forecasting is), we need to process the latest trends as fast as possible, then adapt the direction and speed of our vehicle. Fortunately we have a trick up our sleeve, because any regularly repeating patterns that we recognize along the way (like highway pit stops) are helpful when building our forecast.
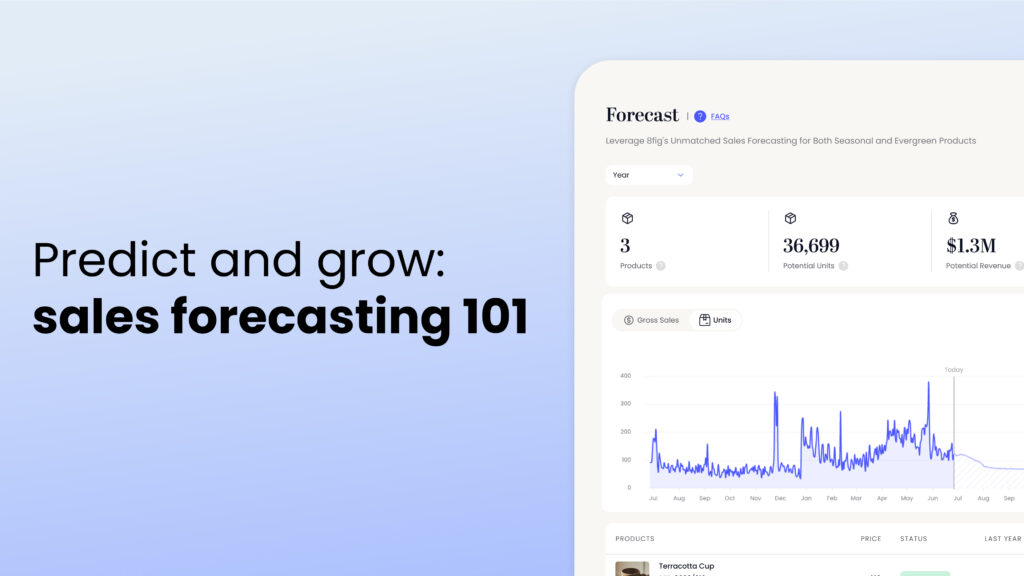
How does 8fig forecast your store’s sales?
When you started your eCommerce business, obtaining a degree in advanced statistics probably wasn’t on your roadmap. Don’t worry – that’s why we’re here!
Before we start, here are some basic rules about our forecasting:
The first rule of forecasting is: You do not talk about forecasting.
The second rule of forecasting is: You DO NOT talk about forecasting! (Just kidding – great movie though.)
(The real) Rule no. 1
When we forecast, we do it on a SKU (stock keeping unit)- and marketplace-specific level, such as Blue Cat Toy on Amazon. This really comes in handy for restocking, and down the line we will add features like grouping products by tag or parentage so you can forecast on a higher level – but you have to stay tuned for that.
Rule no. 2
A SKU needs to have sales history before we can predict its future. In general, we need about 30 days before forecasting can start. Once a SKU has more than a year’s worth of data, then its forecast can take seasonal trends into account. But more on that later.
Rule no. 3
If a SKU doesn’t have consistent sales – for example, if you’re a wholesaler who sells thousands of units in bulk on five random days throughout the year – not even Nostradamus could dream up a forecast, and sadly neither can we.
So, now that you know our basic rules, there is an important term you should get familiar with: forecastability.
The forecastability of a SKU depends on its historical sales pattern. Those with consistent and uniform sales have the best forecastability, meaning that we can be more confident in our prediction, whereas those with inconsistent and fluctuating sales are quite the opposite. Without delving too deeply into the math, forecastability essentially comes down to two metrics: ADI (average demand interval) and CV² (square of the coefficient of variation).
Using these metrics, a SKU is assigned to one of four categories: smooth, erratic, intermittent, or lump.
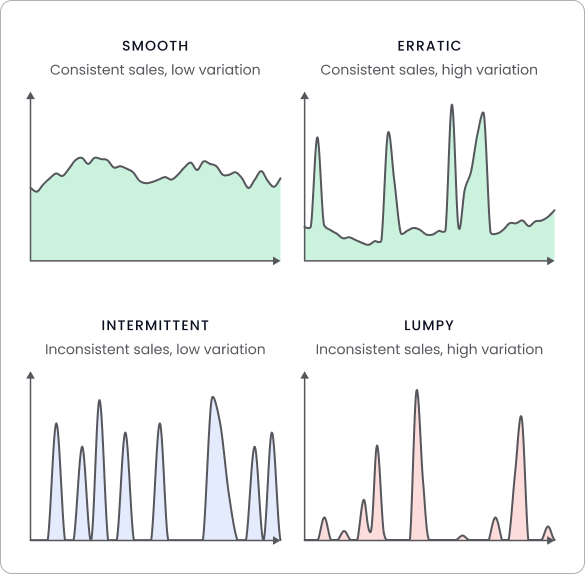
For smooth and erratic products, we use our advanced algorithm to forecast sales. For intermittent products, we use our basic algorithm. For lumpy products, unfortunately, forecasting those would be more guesswork than predicting. We suggest relying on your gut instincts or consulting a psychic!

Might also interest you:
- 8fig’s Sales Forecasting tool – features and benefits
- The ultimate guide to sales forecasting in eCommerce
- What to expect from eCommerce consumer behavior in 2024
Advanced algorithm
Let’s take a closer look at our advanced algorithm:
Data clean-up
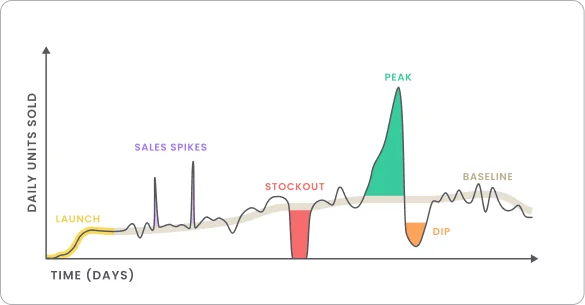
Before our algorithm can forecast future sales, it’s important to first ‘clean up’ the data by removing outliers such as sales spikes, peaks, and dips. We also remove stockout periods because we don’t want to project those into the following year (we hope you’ll stay in stock next time!). After cleaning up, we calculate a smooth baseline that can be projected forward. It’s this baseline upon which we’ll reintroduce peaks and seasonal variations, making your forecast as accurate as possible.
What is the baseline?
The baseline essentially represents how many sales a SKU can expect on a random Tuesday, not influenced by any special occasions. We calculate the baseline by using the most recent ‘cleaned up’ 28-day moving average.
What is the launch phase?
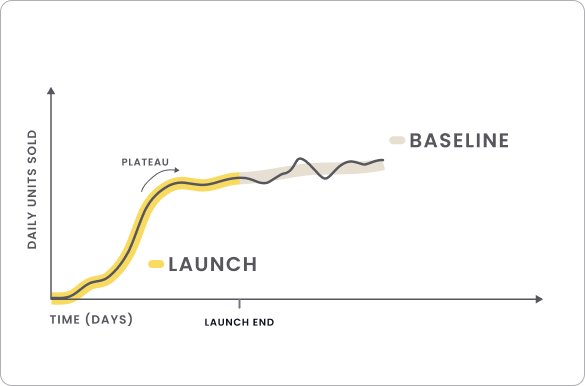
If we notice that your product is still in the launch phase, with sales still ramping up, we will not include these days in its baseline calculation. Only once sales have stabilized will our algorithm begin to calculate a baseline to be used for forecasting.
What are sales spikes?
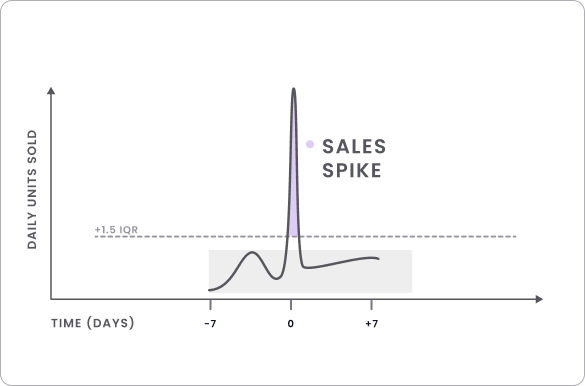
If you have a short-lived increase in sales that seems to happen overnight (meaning it doesn’t gradually increase), then our algorithm will detect it as a sale spike. This could be due to running a flash sale for a week, or because of events like Black Friday, Cyber Monday, Amazon Prime Days, etc. We identify these outliers using the 1.5*IQR (interquartile range) method, which flags anything above a threshold defined by the surrounding days.
What are peaks?
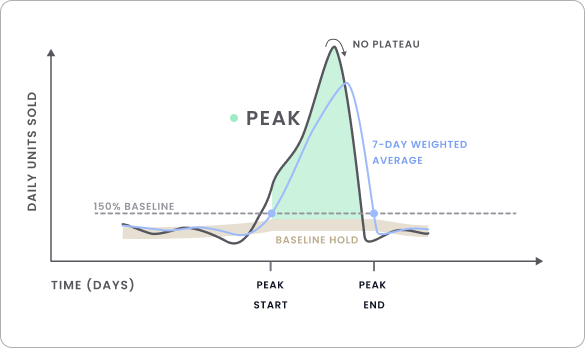
Peaks are periods when your sales slowly increase over time, leading up to a high point before gradually returning to your baseline. This often happens during major holidays or special events, such as Mother’s Day or Christmas. Unlike sudden sales spikes, these increases are more predictable and build up over days or weeks.
Our algorithm is designed to automatically detect these gradual build-ups and label them as peaks. We do this by calculating a 7-day weighted average of a SKU’s current sales and comparing that to its baseline. If the average rises 50% above the baseline, then peak detection is triggered and we exclude these days from the baseline calculation. Once sales drop back to normal, we call an end to the peak and carry on with baseline updates.
What are dips?
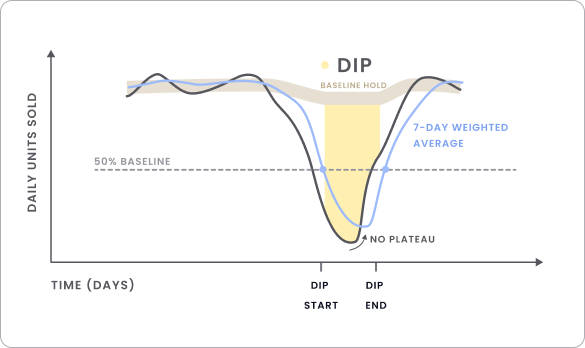
Dips are essentially the opposite of peaks. They occur when your sales gradually decrease to a low point before returning to your baseline. This can happen during off seasons, post-holiday periods, or when customer interest naturally wanes. Our algorithm detects these gradual declines and identifies them as dips. We mostly do this in the same way as peaks, except the 7-day weighted average needs to dip below 50% of the current baseline.
What are stockouts?
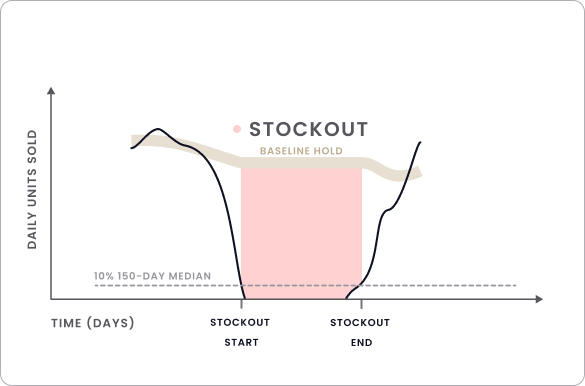
We all know what stockouts are – the absolute worst! And despite our best efforts, they sometimes happen. Our algorithm can detect stockout events by looking for extremely low sales (less than 10% of the last 150-day median) or several days of zero sales in a row. When this happens, we immediately put a hold on the baseline to prevent it from dropping.
This hold can last up to 60 days, meaning that your forecast will continue on as normal during the stockout period. Once your product is back in stock, the baseline picks up where it left off. This means that the stockout won’t be visible in the forecast, because we know you’d prefer to stay in stock the next time around.
Flat forecasting
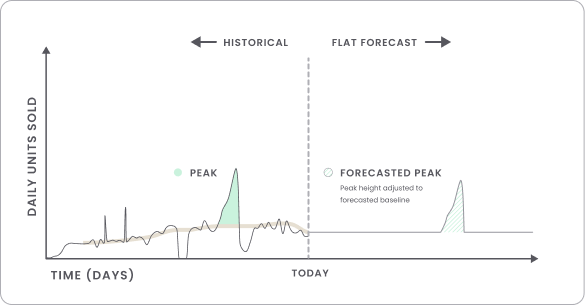
Once we calculate your baseline, we project your sales up to 12 months into the future. We simply take the baseline (think of this as a cleaned-up average daily sales) and project it daily into the future, hence the name flat forecasting. For example, if your current baseline is 28 units sold per day, then we will forecast 280 units in the next 10 days (28 x 10).
The great thing about our baseline method is that any past stockout periods will be ‘filled in’ when the forecast is generated.
When it comes to peaks, if we detect a peak that lasts at least five days from start to finish, we will automatically project it onto next year’s forecast. What’s more, the height of the forecasted peak will be scaled up or down to maintain the same baseline-to-peak ratio as the previous year.
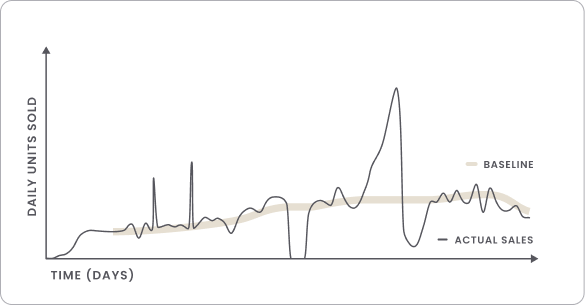
Take a look at this image to better understand how flat forecasting works:
Seasonal forecasting
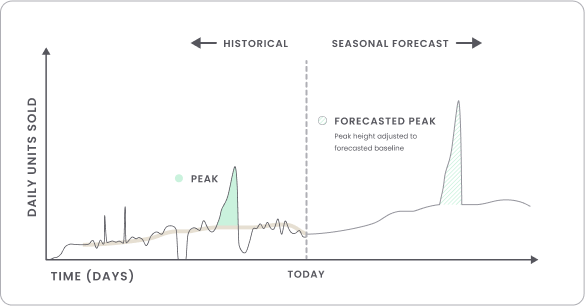
If you have a SKU with at least 12 months of historical sales data, you may be in luck! We will compare last year’s baseline to this year’s to understand the product’s sales seasonality. As long as last year’s baseline is still statistically comparable to this year’s, your product will pass our seasonality check. This means that we will preserve the baseline’s trend and even take its growth into account when forecasting, leading to an accurate seasonal trend line and often a more precise forecast.
Just like with the flat forecast, all peaks lasting at least five days will be included in the forecast on top of the seasonally adjusted baseline.
Have a gander at this image to familiarize yourself with seasonal forecasting:
Upcoming features
In the near future, we will allow you to not only modify our automatically detected peaks but also manually draw your own peaks on top of both flat and seasonal forecasts. We will also provide insights into the accuracy of your forecasts, and use this data to continuously improve our algorithm.
Stay tuned!

to our blog
Read the latest
from 8fig

AI is quietly reshaping eCommerce. Karma’s Hadas Bar-Ad explores how today’s sellers are using intelligent tools to streamline operations, boost efficiency, and drive smarter growth.

WhatsApp isn’t just for memes and group chats anymore. With a 98% open rate, it’s the secret weapon your eCommerce marketing strategy might be missing. Here’s how to do it right.

Stuck with extra inventory after Amazon’s Spring Sale? Learn five smart strategies to clear unsold stock, boost cash flow, and avoid future overstocks with smarter inventory planning.